Resource management software
Effortless Workforce Planning:
Optimize, Track, and Allocate with Ease
With distributed teams, tracking productivity, tool usage, and burnout risk can be challenging.
TeamTrace's workforce management software provides the insights you need to assess performance and make informed, data-driven decisions.
One Powerful Tool to Maximize Your Entire
Workforce Capacity
TeamTrace's resource management tool boosts operational efficiency by optimizing task allocation, enhancing productivity, and ensuring accurate resource use. With real-time insights into workforce activities, it streamlines operations and enables effective project management for better results.
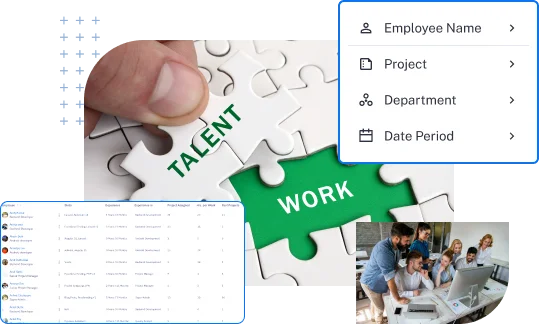
Match Talent to Tasks
Match the right skills to the right projects, boosting efficiency and team performance.
Improved Workload Management
Tasks are evenly distributed, preventing burnout and maximizing productivity.
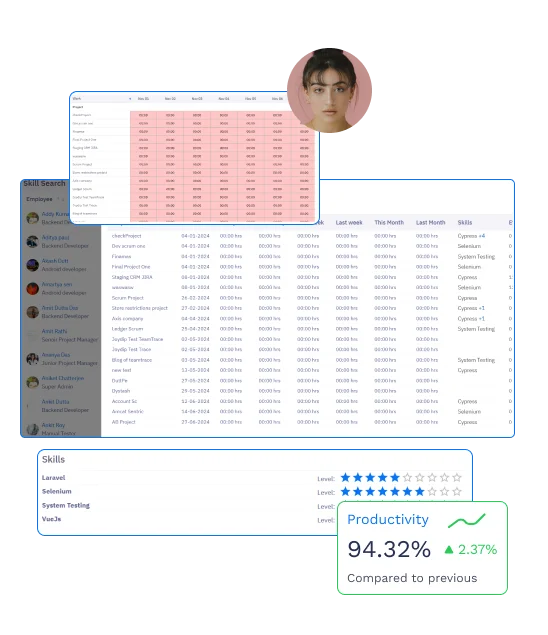
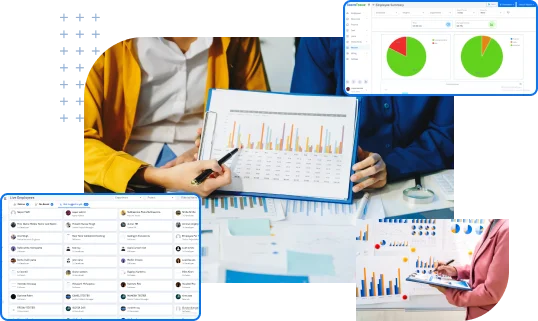
Data-Driven Resource Planning
Unlock valuable insights into employee performance, enabling better planning and resource use.
Enhanced Project Success
TeamTrace resource management software by aligning resources with project needs, these features lead to better project outcomes and overall organizational success.
Uncover Bottlenecks, Reduce Errors, Optimize
Workflows
TeamTrace offers a comprehensive suite of features designed to optimize your workforce management and drive organizational success.
Efficiently plan and manage employee schedules based on availability, skills, and project requirements.
Read More
Track and manage employee leave requests and approvals, ensuring accurate time-off calculations.
Read More
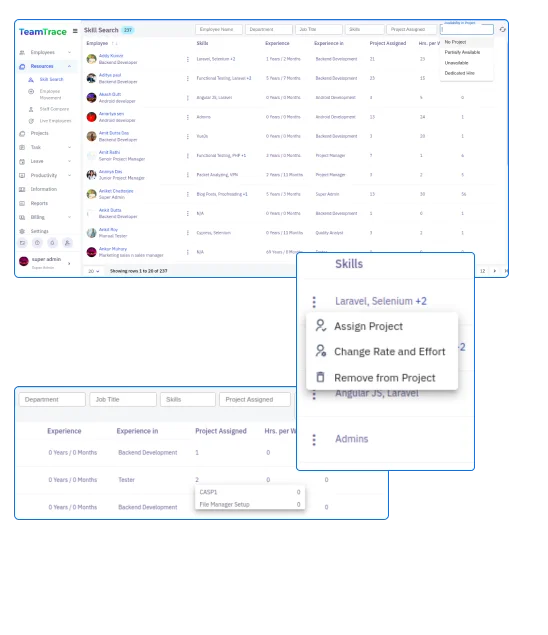
Easily search for employees with specific skills or expertise to match them with suitable projects.
Read More
Identify and assign the right talent to projects based on skill sets and availability using resource management software.
Read More
Track employee workload and capacity to prevent burnout and ensure optimal resource allocation.
Read More
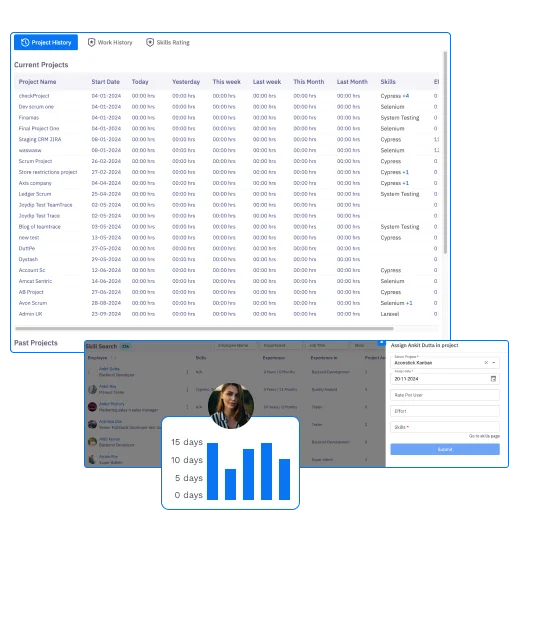
Resource Allocation and Performance History
Monitor resource utilization, track performance metrics, and identify areas for improvement.
Read More
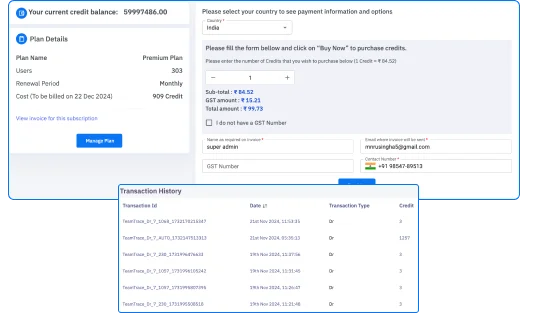
Resource Utilization and Requests
Manage resource requests, track utilization rates, and optimize resource allocation.
Read More
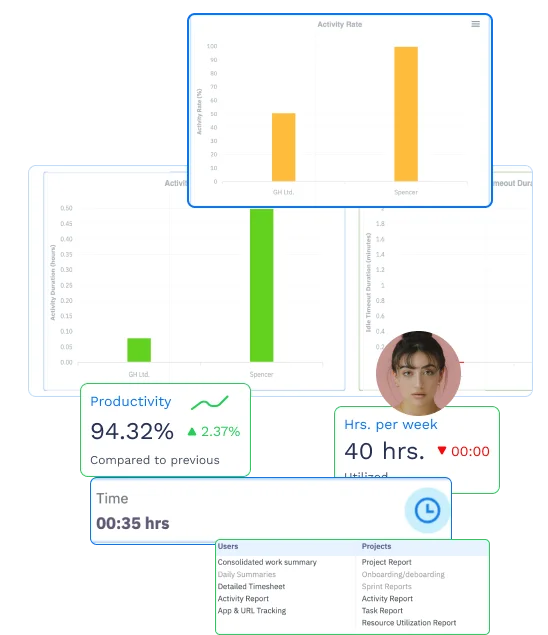
Generate detailed reports on employee activity, productivity, and project progress with TeamTrace workforce management software.
Read More
How to Use TeamTrace to Manage Your
Workforce
-
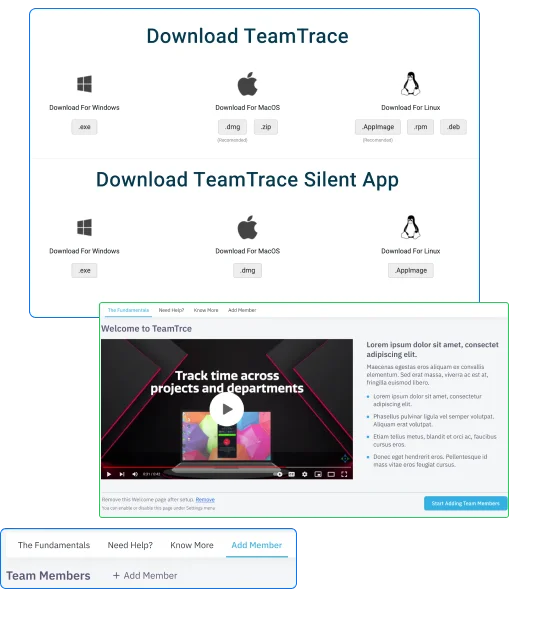
Set Up Your Team:
Add team members to TeamTrace, including their names, roles, and contact information.
Define team structures and hierarchies to reflect your organization's structure.
-
Track Employee Activity:
Use TeamTrace's calendar integration to track employee availability and schedule time off.
-
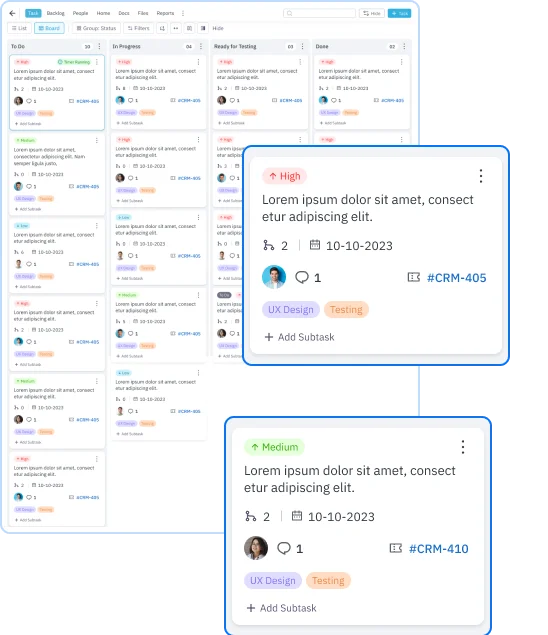
Assign Tasks and Projects:
Assign tasks and projects to team members based on their skills, workload, and availability.
Set deadlines and priorities for each task.
-
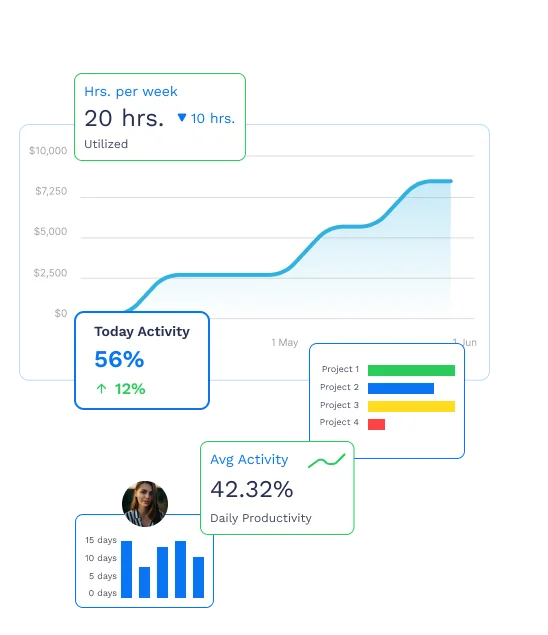
Monitor Progress and Productivity:
Track employee activity, task completion, and project progress in real-time.
-
Manage Resources:
Allocate resources effectively based on project requirements and employee availability.
-
Provide Feedback and Coaching:
Use TeamTrace's performance tracking features to provide regular feedback and coaching to employees.
-
Analyze and Report:
Generate 20+ reports and use these insights to make data-driven decisions and optimize your workforce management strategies.


 1.svg)