whatsapp-icon

Amplify Positive Project Outcome by 82% with

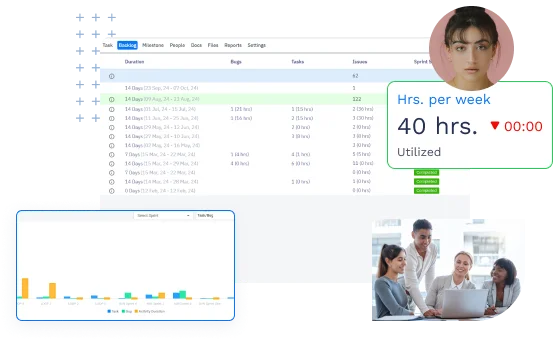
Access 12+ powerful reports to drill into crucial insights for respective projects. Get in-depth reports based on crucial parameters. Track progress, measure performance, and make decisions with confidence.

Available for:

Challenges of Not Using a Project Reporting Software

image

Lack of Visibility

Gaining a clear view of project updates becomes difficult in the absence of detailed reports. This results in missed deadlines and overlooked issues.

image

Inability to Pin-point Trends

Without the ability to analyze and interpret historical performance data, teams miss out on lessons that can guarantee success for future projects.

image

Inadequate Resource Allocation

Not assessing individual contributions and workload distribution may result in severe misallocation of resources.

Drive Efficiency & Maximize Results by 95%

our-story
  • icon
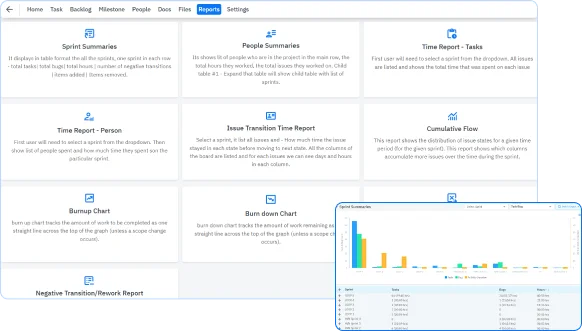
    Diverse Reporting Options: With 12 different types of reports readily available, you can fine-tune your data analysis to match your exact needs. Explore sprint-based reports, Kanban reports, and more, to gain insights needed to manage projects effectively.
  • icon
    100% Customized Reports: Enjoy the flexibility to create customized reports that deliver the exact insights you and other stakeholders require. Choose filters such as sprints, tasks/bugs, and dates to retrieve the information that you need.
  • icon
    Flexible Reporting in Any Format: Keep your stakeholders informed without the hassle of compatibility issues. Save reports as PDFs, Excel, or CSV files for easy & swift access.
  • icon
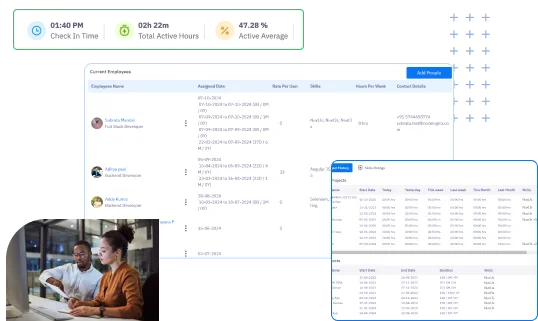
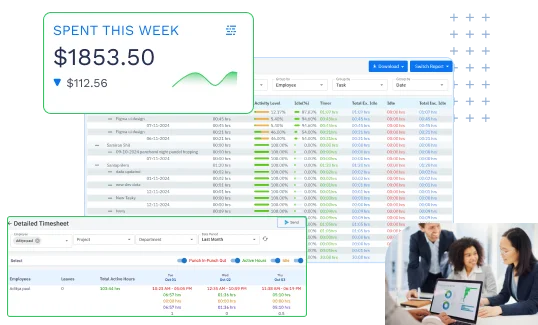
    In-depth Analysis of Work Contributions: Zoom in on specific team members or tasks to get a good hold of the contributions made for that project. Against each team member’s profile in the report, view the total hours spent on that task along with their work history and skills ratings easily.

Hear from One of Our Happy Clients

I am in awe with TeamTrace's Project Management suite. The diverse tools available here are mind-blowing. Collaboration has become seamless & we’ve attained better project outcomes.

Emily C.

Operations Director

Make the Most of Diverse In-depth Project Reports

Seamless cloud storage, anytime access, easy collaboration and ultimate peace of mind-everything you need is right here!

switch-image
switch-image
switch-image
switch-image
switch-image
switch-image
switch-image
switch-image
switch-image
switch-image
switch-image
icon

Sprint Summaries

View details of all the sprints in a neat tabular format, with each sprint being displayed in separate rows. Track the total activity duration spent while using filters such as dates and tasks or bugs reported.

  • Sprint-based differences to evaluate performance
  • Analysis of team members' contributions to each sprint
switch-image
icon

People Summaries

Obtain user-specific insights to see the sprint details on which each team member worked. You can also view issue counts and activity duration against the label of each team member.

  • Get a clear picture of work done individually
  • Identify areas for improvement
switch-image
icon

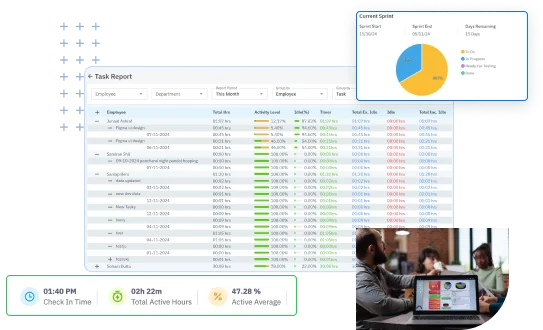
Time Report- Tasks

Easily track hours spent on tasks serialized as tickets. Make the most of filters such as tasks or bugs and date to analyze critically and identify optimization opportunities.

  • View hours spent on each bug or task
  • Get detailed information on work log and history
switch-image
icon

Time Report- Person

By using “people” as the main parameter, you can view the hours spent on projects by each one of the assigned team members. Quickly view the start and end date of projects along with time spent on tasks weekly, as well as, monthly.

  • Gauge work history by employee
  • Clear view of time dedicated for each project
switch-image
icon

Issue Transition Time Report

Closely monitor how long tasks are staying in various project statuses. Identify blockers by assessing time spent in “To Do,” “In Progress,” and “Completed” stages.

  • Determine if time spent is genuine or overdue
  • Quickly narrow down on delays in the project lifecycle
switch-image
icon

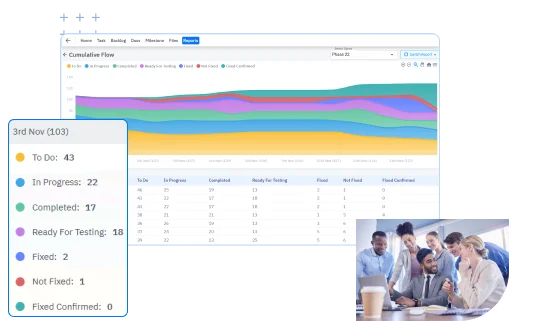
Cumulative Flow

View the distribution of issue states for a given period or sprint in a clear graphical format. You can effortlessly figure out which columns accumulate more issues over the time while running a sprint.

  • Hassle-free identification of stages where issues are piling up
  • Quickly detect patterns in issue accumulation during sprints
switch-image
icon

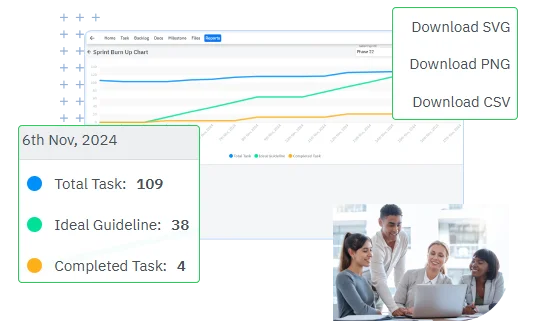
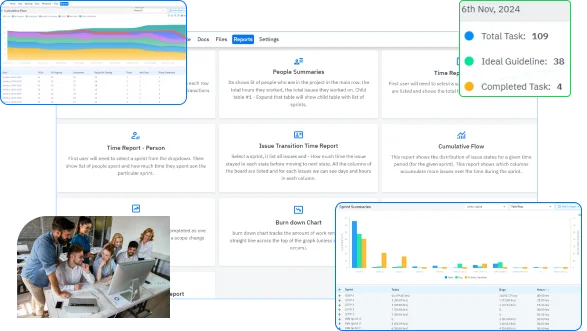
Burnup Chart

By using sprint burnup chart, you can view a transparent line graph depicting the number of completed tasks out of total tasks against the set ideal guidelines. This helps in easy identification of any changes made in project scope over the sprint.

  • Visualize how much work has been completed against the total scope
  • Assess team performance and productivity throughout the sprint
switch-image
icon

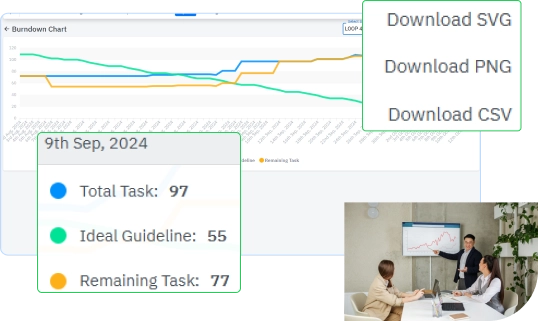
Burndown Chart

Obtain a crystal-clear view of the amount of work remaining as a single straight line across the graph. Getting an accurate idea of your teams' workload and pace becomes simpler.

  • Helps understand if the team is on track to meet the sprint goal
  • Aids in refining future sprint estimates and planning
switch-image
icon

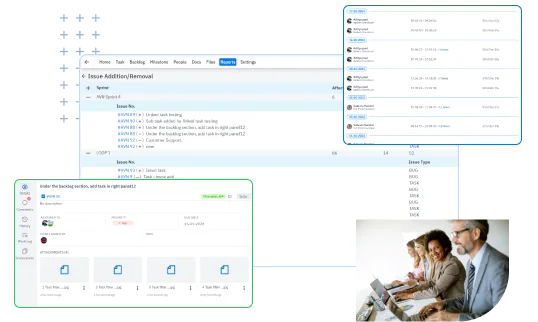
Issue Addition or Removal Report

Get a clear idea of the total issue count and keep track of the changes made in the addition or removal of issues from a project over a specified period.

  • Aids in better understanding of scope fluctuations over time
  • Helps adjust resource allocation based on dynamic project demands
switch-image
icon

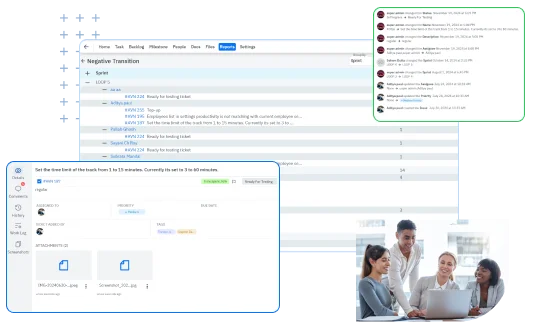
Negative Transition or Rework Report

Keep a clear tab of instances where tasks revert to previous states, say, a task going back to “In-progress” from “Completed” stage. This guides you in indicating issues like rework or task delays within a project.

  • Highlights frequent rework areas, enabling root cause analysis
  • Reduces wasted effort by addressing recurring issues quickly

Start Analyzing Your Projects Like Never Before with

Varied Reports

How Project Reporting Works

image

Remote Teams

Access real-time data and generate reports from anywhere, ensuring seamless collaboration and transparency.

image

Hybrid Teams

Centralized reporting allows for consistent insights across both remote and in-office members, fostering unified project tracking

image

In-Office Teams

Utilize detailed reports to enhance on-site collaboration, making performance evaluation straightforward and efficient.

Why Should You Start Using

our-story
  • icon
    Greater Clarity: Make your way through complex data easily. Our reports simplify project insights, making it simpler for you to identify strengths and weaknesses.
  • icon
    Enhanced Accountability: With detailed reports on individual contributions and task statuses, you foster a culture of accountability within your team.
  • icon
    Data-driven Decision Making : Utilize data-driven insights to make informed decisions that enhance project outcomes and boost team performance.
  • icon
    Scope of Continuous Improvement: Make the most of insights derived from previous sprints to refine processes, optimize resource allocation, and drive future success.

Top Industries That Prefer

TeamTrace's File Manager is a powerful and intuitive solution to boost productivity across key industries.

image

IT Companies

Enhances project tracking and resource efficiency

image

Customer Support

Improves service performance insights and resolution times

image

Call Centers

Analyzes agent performance for operational improvements

Explore the Use Cases of

image

Productivity Monitoring

Track team output and performance trends

image

Time & Attendance

Record hours worked and attendance patterns

image

Project Management

Monitor project progress and resource allocation

Frequently Asked Questions

You can generate several kinds of reports by using TeamTrace. These include sprint summaries, issue transition and time reports, burndown charts, etc.- all tailored to meet your specific needs.

No, there is no such limit here! You can create as many reports as you need to effectively manage and analyze your project progress.

Yes, you can generate reports for any project within your TeamTrace account, allowing you to access historical data.

Yes, we offer online tutorials, guided videos, and documentation to help you get the most out of our project reporting features.

Ensure Project Success by 98% with Our Detailed

Project Reporting Suite